SPRAY COOLING
COMPARATIVE ANALYSIS
21 June
2001
Prepared by:
Naval Surface
Warfare Center
Crane Division
300 Highway 361
Crane, Indiana
47522-5001
Goals
The main objective of this project is to evaluate the
effectiveness of spray cooling technology for Commercial Off The Shelf (COTS)
electronics in military applications.
Positive results from this evaluation will provide the military with a
COTS solution option to mitigate the environmental risks and allow the insertion
of state-of-the-art high-power, high-density commercial
electronics.
Background
The use of COTS
electronics in military systems has become a fact of life. Due to the shift toward use of commercially
available off-the-shelf items, the military as a customer has become less of a
driving force in the design of these products.
There has been a large reduction in the number of manufacturers willing
or able to supply “ruggedized” electronics that will meet the stringent
environmental, reliability and space/size requirements of military programs, yet
the military must still deploy the most capable systems possible in these harsh
environments.
Military system
designers use two basic techniques to deal with the problem. One is to seek out vendors who offer
ruggedized products that are designed to meet the harsh requirements and build
the system in a traditional enclosure.
This approach often works, but there are many limiting problems, such as
very few sources for critical parts, tight design tolerances, and
mechanical/material issues. Enclosures for these systems offer some
protection from the external environment, but are often limited to the level
that the ruggedized components can tolerate.
The other approach is to
design enclosure-based protection for the off-the-shelf products so that the
demanding external environment doesn’t affect the more delicate internal
electronic parts. The enclosure, in this
case, becomes more than just a box to hold the parts together and serve as a
static heat sink. This enclosure
functions as a key element of the total system solution.
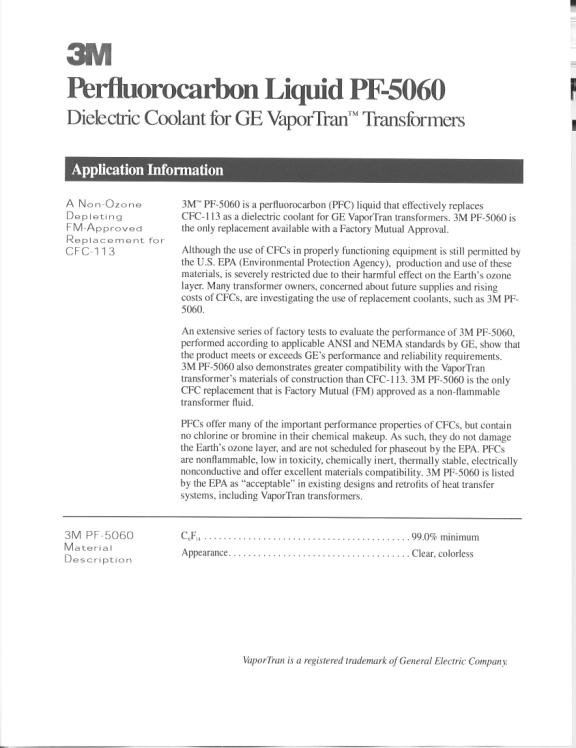
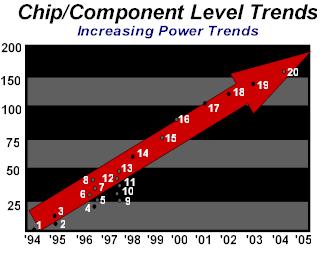
One of the major
challenges in designing such an enclosure is thermal management. As Figure 1 shows, there is a trend for
increasing power densities in emerging electronic technology. However, traditional cooling techniques
greatly limit the choice of components available to the military system
designer.
Spray cooling is a
technique where a mist of inert liquid coolant is directed upon the components
inside a sealed enclosure by pumps and nozzles.
The vapor generated after the liquid contacts the hot components can be
condensed on the chassis walls, or in a remote heat exchanger. Heat removed to the chassis walls is
externally carried through natural or forced convection. In the case of a remote heat exchanger, air
is forced over the heat exchanger core in order to reject the heat.
|
|
1
|
386 3 watts
|
|
2
|
Power PC 6 watts
|
|
3
|
486 8
watts
|
|
4
|
Pentium 13 watts
|
|
5
|
Cyrix 125 MHz 18 watts
|
|
6
|
Power PC 20 watts
|
|
7
|
Pentium Pro 25 watts
|
|
8
|
Alpha 500 MHz 45 watts
|
|
9
|
Power PC 266 MHz 25 watts
|
|
10
|
Pentium 233 MHz 27 watts
|
|
11
|
Pentium II 233 MHz 36 watts
|
|
12
|
Pentium II 300 MHz 43 watts
|
|
13
|
Ultra Sparc 50 watts
|
|
14
|
1998 CPU 50 watts
|
|
15
|
1999 CPU 75 watts
|
|
16
|
2000 CPU 85 watts
|
|
17
|
2001 CPU 125 watts
|
|
18
|
2002 CPU 140 watts
|
|
19
|
2003 CPU 175
watts
|
|
20
|
2004 CPU 200
watts
|
Figure 1-Chip/Component Level Trends.
Approach
This project focuses
on comparing the cooling effects of a standard air-cooled, COTS electronic
system to the cooling effects of a spray-cooled system manufactured by
Isothermal Systems Research (ISR) (Clarkston,
Washington).
The first phase of
this evaluation consisted of establishing a baseline with an existing VME
air-cooled card cage (see figure 2) containing four heat load
modules. The card cage is an air-cooled
enclosure capable of housing up to 21, 6U X160 VME cards, with a 700 watt power
supply containing 3 muffin fans for cooling.
The test setup contained the four heat load modules and 17 blank cards to
maintain a balanced air flow across each module (see figure 2). These load modules were VME bus slot load
boards manufactured by Dawn VME Products.
The load boards were used to simulate a working VME module and capable of
producing a fifty watt heat load per module.
Four modules were used in this test with one to four activated at various
times. The center module was always
activated and was populated with five thermocouples distributed throughout the
board as follows:
-
One on a resistor that was not powered
-
Another on a resistor with a 3.1watt heat
load
-
A third on the board surface
-
The fourth on a 3.1watt resistor that was
powered on
-
The fifth on another resistor that was not
powered
The thermocouple
locations were selected to measure temperatures of components across the
module. In addition to the thermocouples
placed on the module, others were used to measure the card cage inlet, exit and
ambient fluid temperatures. The
thermocouples were Omega T-type (Copper-constantan), with a 0.10 inch diameter
and were attached to the resistive heaters using thermal epoxy.
Figure 2-VME
Chassis & Load Board
The spray-cooling phase
consisted of utilizing a Portable Laboratory Support Unit (PLSU) and an Acrylic
Test Chassis (ATC) purchased from ISR (See Figures 3 & 4).
Figure 3-Portable Laboratory
Support Unit (PLSU)
(with front and
side panel removed)
Figure 4-Acrylic Test Chassis
(ATC)
Rear and Front
Views
For consistency, the
same set of heat load modules previously described in the air-cooled section
were utilized for the spray-cooled evaluations.
By keeping the power level on the heat load modules consistent in all of
testing, the differences in the recorded temperatures were an actual result of
the cooling methodology.
Test Procedure
The thermal
testing was divided into four major parts:
1)
Air cooling at ambient room temperature
2)
Air cooling at elevated temperature
3)
Spray cooling at ambient room temperature
4)
Spray cooling at elevated temperature
1) Air Cooling
at Ambient Room Temperature
This examination was performed at 25°C at four
different power levels 50W, 100W, 150W, and 200W. The power levels were obtained by use of heat
load modules see figure 2. Each module
was setup for 50W. Four modules were
placed in the VME air-cooled card cage.
The test data was recorded on a Fluke data logger (see Appendix B for typical data recorded).
2) Air
Cooling at an Elevated Temperature
This examination was
performed at three different temperatures 35°C, 45 °C, and,
55°C as well as four different power levels
50W, 100W, 150W, and 200W. The test
setup was similar to the air cooling at ambient room temperature test but the
test unit was placed in the thermal chamber.
3) Spray Cool at Ambient Room
Temperature
This examination was
preformed using the spray cooling system (see figure 3 and 4) in the
laboratory. The procedure is the same as
the air cooling at ambient room temperature of 25°C but ran
at four fluid flow rates, 890ml/min (15 psia), 1000ml/min (20 psia), 1300ml/min
(25 psia), and 1500ml/min (30 psia) (see Appendix B for typical data). The data
collection and evaluation remained constant throughout the evaluations.
4) Spray Cool
at Elevated Temperature
This
examination was performed at three different temperatures 35°C, 45 °C, and,
55°C, four different power levels 50W, 100W,
150W, and 200W and four different flow rates 890ml/min (15 psia), 1000ml/min (20
psia), 1300ml/min (25 psia), and 1500ml/min (30 psia). The test setup was similar to the spray
cooling at ambient temperature but the test unit was placed in the thermal
chamber.
Results/Accomplishments
The results
of this thermal evaluation indicate that a significant heat removal gain is
achieved by employing spray cooling heat transfer technology. As a result of all the testing, the spray
cooling consistently out preformed the air-cooling. The amount of improvement ranged from 5 to 20
times the heat removal of a standard air-cooled chassis depending upon the
surrounding temperature, heat load and liquid flow rate/pressure. See TABLES 1 and 2 for test data from thermocouple #3 and FIGURES 6 and 7 for graphical representations of the test
results.
FIGURE 6-AIR/SPRAY AT ROOM AMBIENT
|
Air
Cooling
Air flow : 200
ft/min
All temps for TC3 (See Fig 2)
|
|
Heat load
|
Air - 24.1C
amb
|
Air - 37.8C
amb
|
Air - 46.4C
amb
|
Air - 57.7C
amb
|
|
Watts
|
Temp. Deg.
C
|
Temp. Deg.
C
|
Temp. Deg.
C
|
Temp. Deg.
C
|
|
50
|
112.3
|
123.3
|
131.0
|
142.3
|
|
100
|
134.2
|
124.0
|
138.8
|
150.0
|
|
150
|
142.4
|
132.6
|
140.9
|
152.4
|
|
200
|
142.0
|
133.1
|
141.7
|
152.8
|
TABLE 1 AIR FLOW TEST DATA
Tc3
|
Spray
cooling
|
|
|
|
|
|
|
15 psia (890
ml/min)
|
20 psia (1000
ml/min)
|
25 psia (1300
ml/min)
|
30+ psia (1300+
ml/min)
|
Boiling
point
|
|
Heat load
|
Spray - 24C
|
Spray - 24C
|
Spray - 24C
|
Spray - 24C
|
(approx)
|
|
W
|
|
|
|
|
C
|
|
50
|
40.0
|
39.2
|
38.7
|
38.3
|
|
|
100
|
41.9
|
41.9
|
41.4
|
41.3
|
|
|
150
|
45.7
|
44.5
|
43.8
|
41.4
|
|
|
200
|
49.1
|
47.7
|
46.8
|
46.1
|
57
|
|
|
|
|
|
|
|
|
|
15 psia (890
ml/min)
|
20 psia (1000
ml/min)
|
25 psia (1300
ml/min)
|
30+ psia (1300+
ml/min)
|
|
|
Heat load
|
Spray - 35C
|
Spray - 35C
|
Spray - 35C
|
Spray - 35C
|
|
|
W
|
|
|
|
|
|
|
50
|
52.4
|
51.5
|
51.6
|
51.2
|
66
|
|
100
|
52.4
|
52.5
|
50.7
|
49.8
|
65
|
|
150
|
53.3
|
52.9
|
51.4
|
50.4
|
60
|
|
200
|
56.1
|
56.3
|
53.9
|
52.1
|
65
|
|
|
|
|
|
|
|
|
|
15 psia (890
ml/min)
|
20 psia (1000
ml/min)
|
25 psia (1300
ml/min)
|
30+ psia (1300+
ml/min)
|
|
|
Heat load
|
Spray - 45C
|
Spray - 45C
|
Spray - 45C
|
Spray - 45C
|
|
|
W
|
|
|
|
|
|
|
50
|
57
|
57
|
53
|
55
|
66
|
|
100
|
58
|
57
|
54
|
55
|
65
|
|
150
|
60
|
58
|
55
|
57
|
66
|
|
200
|
61
|
58
|
57
|
56
|
65
|
|
|
|
|
|
|
|
|
|
15 psia (890
ml/min)
|
20 psia (1000
ml/min)
|
25 psia (1300
ml/min)
|
30+ psia (1300+
ml/min)
|
|
|
Heat load
|
Spray - 55C
|
Spray - 55C
|
Spray - 55C
|
Spray - 55C
|
|
|
W
|
|
|
|
|
|
|
50
|
59.6
|
57.0
|
54.5
|
54.4
|
66
|
|
100
|
60.5
|
59.8
|
57.5
|
57.9
|
65
|
|
150
|
63.0
|
59.9
|
57.7
|
59.6
|
65
|
|
200
|
63.9
|
62.6
|
60.7
|
55.2
|
65
|
TABLE 2 SPRAY COOLING TEST DATA Tc3
FIGURE
7-AIR/SPRAY AT 55 DEGREES C
The results of this investigation clearly indicate that the spray cooling
system was not challenged at the stated temperatures, heat loads and flow
rates/pressures. In order to more
thoroughly evaluate spray cooling, NSWC Crane has identified a military system
slated to utilize spray cooling in a harsh environment and are in the process of
performing a reliability projection of the COTS electronics. This analysis will yield a reliability
comparison (air vs. spray) at the system, sub-system, module and component
level.
The next
phase of evaluations will include:
§
Reliability
Verification
§
Environmental
Certification
o
Shock/Vibration
o
Toxicity/Flammability
o
Mechanical
o
Altitude
o
Humidity
§
Material Compatibility
Analysis
§
High Power
Component/Module Testing
APPENDIX A
3M Fluorinert PF
5060